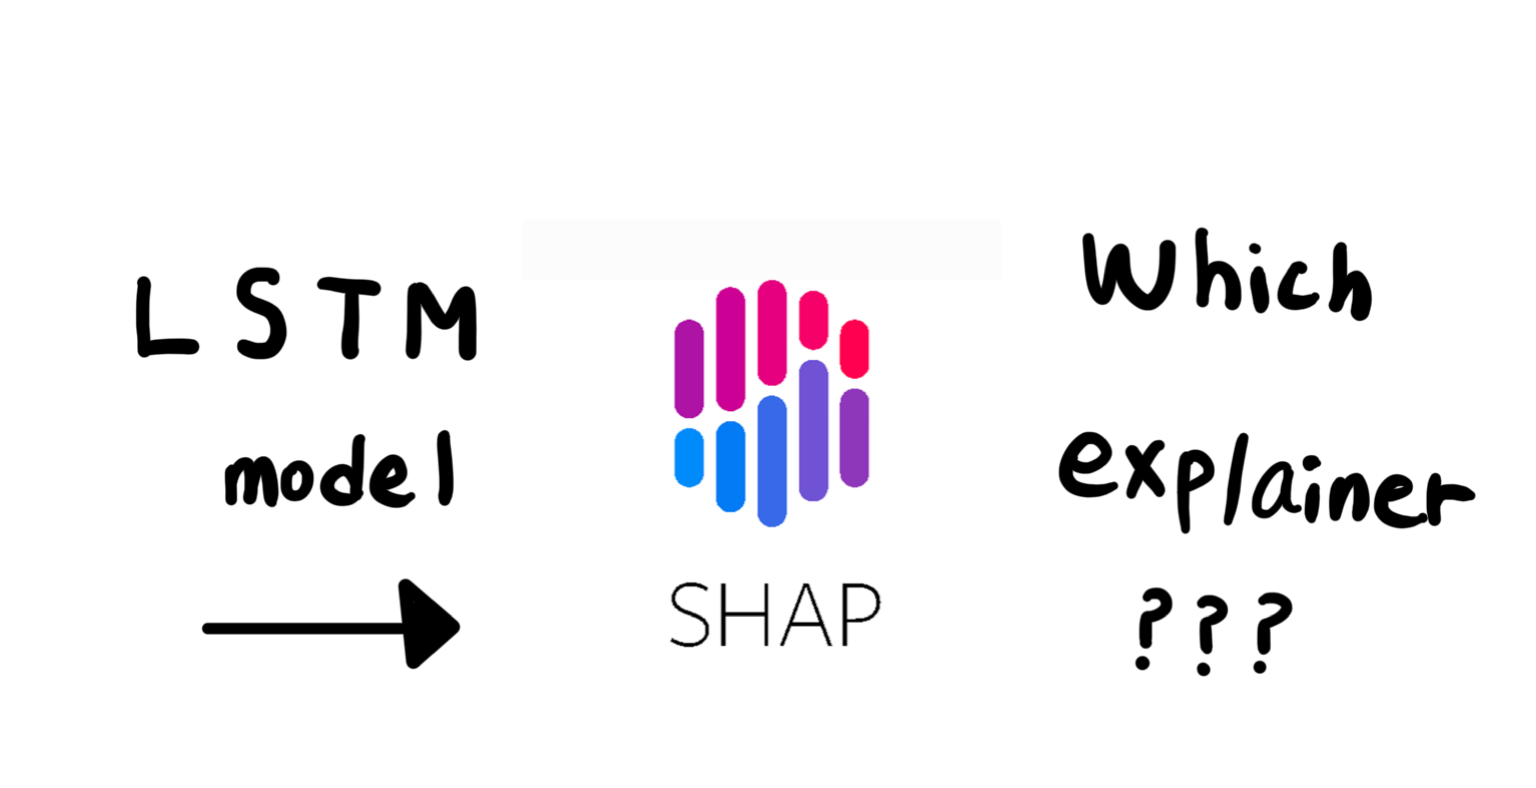
WHAT is SHAP?
SHAP(SHapley Additive exPlanations) values are used to explain the output of any machine learning model. They are based on concepts from cooperative game theory, specifically the Shapley value, which fairly distributes the “payout” (in this case, the prediction) among the “players” (features) based on their contributions.
WHY use SHAP?
Because of Model Interpretability!
SHAP provides a unified measure of feature importance, showing how each feature contributes to the model’s prediction for a given instance. This is crucial for understanding models like deep neural networks, gradient boosting machines, or any other complex models that are often seen as “black boxes.”
There are several explainers we can use.
- TreeExplainer
This is optimized for tree-based models like decision trees, random forests, and gradient boosting machines(XGBoost, LightGBM, CatBoost) - KernelExplainer
It is a model-agnostic explainer, which means it can be used with any ml model, regardless of its type. - DeepExplainer Designed for deeplearning models created with Tensorflow or Pytorch
- LinearExplainer
Made for linear models, such as logistic regression or ordinary least squares regression. This is ideal for interpreting models where the relationships between features and predictions are straightforward and additive. - PartionExplainer
An extension version of TreeExplainer! (When dealing with extremely large decision trees) - GradientExplainer
Similar to DeepExplainer, but specifically optimized for models that use gradient boosting, such as XGBoost or LightGBM.

It is said that most deep learning based models are worked with DeepExplainer.
But when we deep dive into it, DeepExplainer is primarily designed for feedforward neural networks and CNNs, which have a more straightforward, static input-output relationship. LSTMs, with their recurrent nature, complex internal states, and dependence on the entire sequence of inputs, pose significant challenges for DeepExplainer. And therefore, Long Short-Term Memory (LSTM) networks, which are a type of recurrent neural network (RNN), present specific challenges when it comes to using SHAP’s DeepExplainer.
Those are the possible scenarios why LSTM struggles with DeepExplainer.
1. LSTMs Have Recurrence: LSTM networks process data sequentially, maintaining a hidden state that is updated at each step in the sequence. This recurrence means that the output at each time step depends not only on the current input but also on the entire sequence of previous inputs.
2. Complex Internal States: LSTM networks have complex internal states (cell state and hidden state) that are updated using gating mechanisms (input gate, forget gate, output gate). These operations are not straightforward to interpret using methods designed for feedforward networks like DeepExplainer.
In my experience, and in my case of modeling, All I can say is
Try GradientExplainer
Below is the code that i used to get the shapvalues and visualize the feature importance after building a model.
1
2
3
4
5
6
7
8
9
10
11
12
13
14
15
16
17
18
19
20
21
22
23
24
25
26
27
import shap

explainer = shap.GradientExplainer(model, input_x)

#calculate shap values
shap_values = explainer.shap_values(input_x)

#Calculate mean absolute SHAP values for each input set
#in this case, I used two different input sets
mean_shap_1 = np.abs(shap_values[0][0]).mean(axis = 0).reshape(-1)
mean_shap_2 = np.abs(shap_values[0][1]).mean(axis = 0).reshape(-1)
all_mean_shap = np.concatenate([mean_shap_1, mean_shap_2])

#setup feature names
feature_names_1 = list(x_train.iloc[:,:n].columns)
feature_names_2 =list(x_train.iloc[:,:n].columns)
all_feature_names = feature_names_1 + feature_names_2


#Create a bar plot for feature importance
plt.figure(figsize = (8,4))
plt.bar(all_feature_names, all_mean_shap)
plt.xlabel(‘features’)
plt.ylabel(‘Mean of Shap Value (Feature Importance))
plt.title(‘Overall Feature Importance’)
plt.xticks(rotation = 45)
plt.show()
References
https://shap.readthedocs.io/en/latest/
