
Location Optimization Project for Battery Swapping Stations
Geospatial Data
Feature Engineering
XGBoost Regression
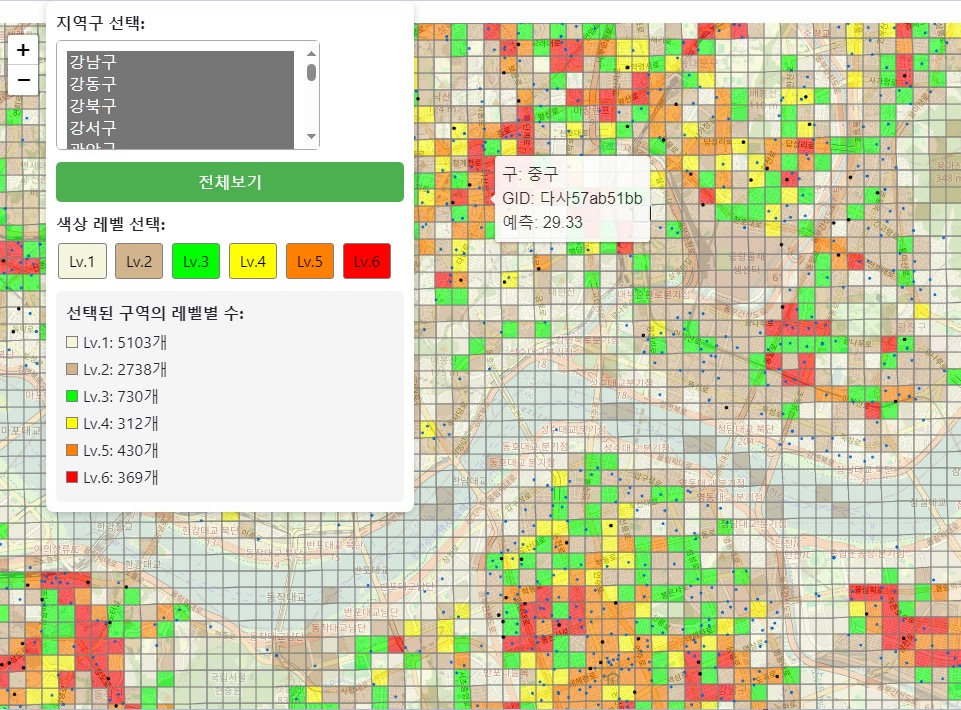
Map Visualization
Design
This project aimed to support location planning for expanding battery swapping stations (BSS) beyond Seoul using data-driven analysis.
We predicted the expected usage (i.e., number of battery swaps) for each 250m × 250m grid across Korea to identify areas with high potential demand.
Data
- Target variable: Actual number of battery swaps per grid in Seoul
- Grid unit: 250m × 250m and 50m × 50m
- Data sources:
- Public data (Statistics Korea): population by gender and age group
- Geospatial features: slope data, distance to nearest subway station
- Commercial data: national convenience store locations, business listings
- Mobility data: telecom-based floating population, especially rider mobility
Main Model / Technique
XGBoost Regressor
We trained an XGBoost model to predict battery swap counts per grid using spatial and behavioral features.
- Key features that strongly influenced the model included:
- Rider mobility
- Population density
- Slope (incline)
- Distance to the nearest subway station
- The model achieved a MAPE of 22%, but given the limited training data (~300 samples), the performance was acceptable for guiding strategic decisions.
Consideration
- Rather than focusing purely on modeling, this project emphasized feature engineering and selection.
- Data availability was limited to Seoul, so we trained the model on Seoul and analyzed what made high-demand zones different.
- Applying this model to other regions was not ideal due to varying local characteristics; general direction might hold, but not detailed precision.
- Visualization played a key role — we used
foliumandgeopandasto build an interactive map that visualized demand predictions and priority areas.
Collaboration & Deployment
- I played a central role in communicating between our modeling team and the counterpart business team, ensuring alignment and clarity at every step.
- The final interactive HTML-based map was handed off to the stakeholder team, who used it to determine the priority order for station installation in new regions.
- According to internal reports, the installation followed our model’s recommendation, though validation will require post-installation data over several months.
Result
- Built a deployable location recommendation pipeline using real-world constraints
- Delivered a practical tool that guided real installation decisions
- Strengthened the team’s understanding of how data-driven tools can inform urban infrastructure planning
Future Ideas
- Collecting more data from other regions to support transfer learning and region-specific fine-tuning
- Developing more localized models for mid- to small-sized cities based on their unique mobility and demographic characteristics
Reflections
- Reinforced the importance of feature quality over model complexity
- Learned the power of effective communication across functional teams
- Realized how crucial it is to think about how predictions are visualized and delivered, not just how they’re made